- Risk Matrix Configuration
Risk Matrix Configuration
Risk Matrix Tab Configuration
The next step is to set up a risk matrix, appropriate for the types of risks which will be handled in this configuration.
A risk matrix is intended to provide a risk level or score, which results from evaluating how probable an event might be, against the severity of the effect it might have.
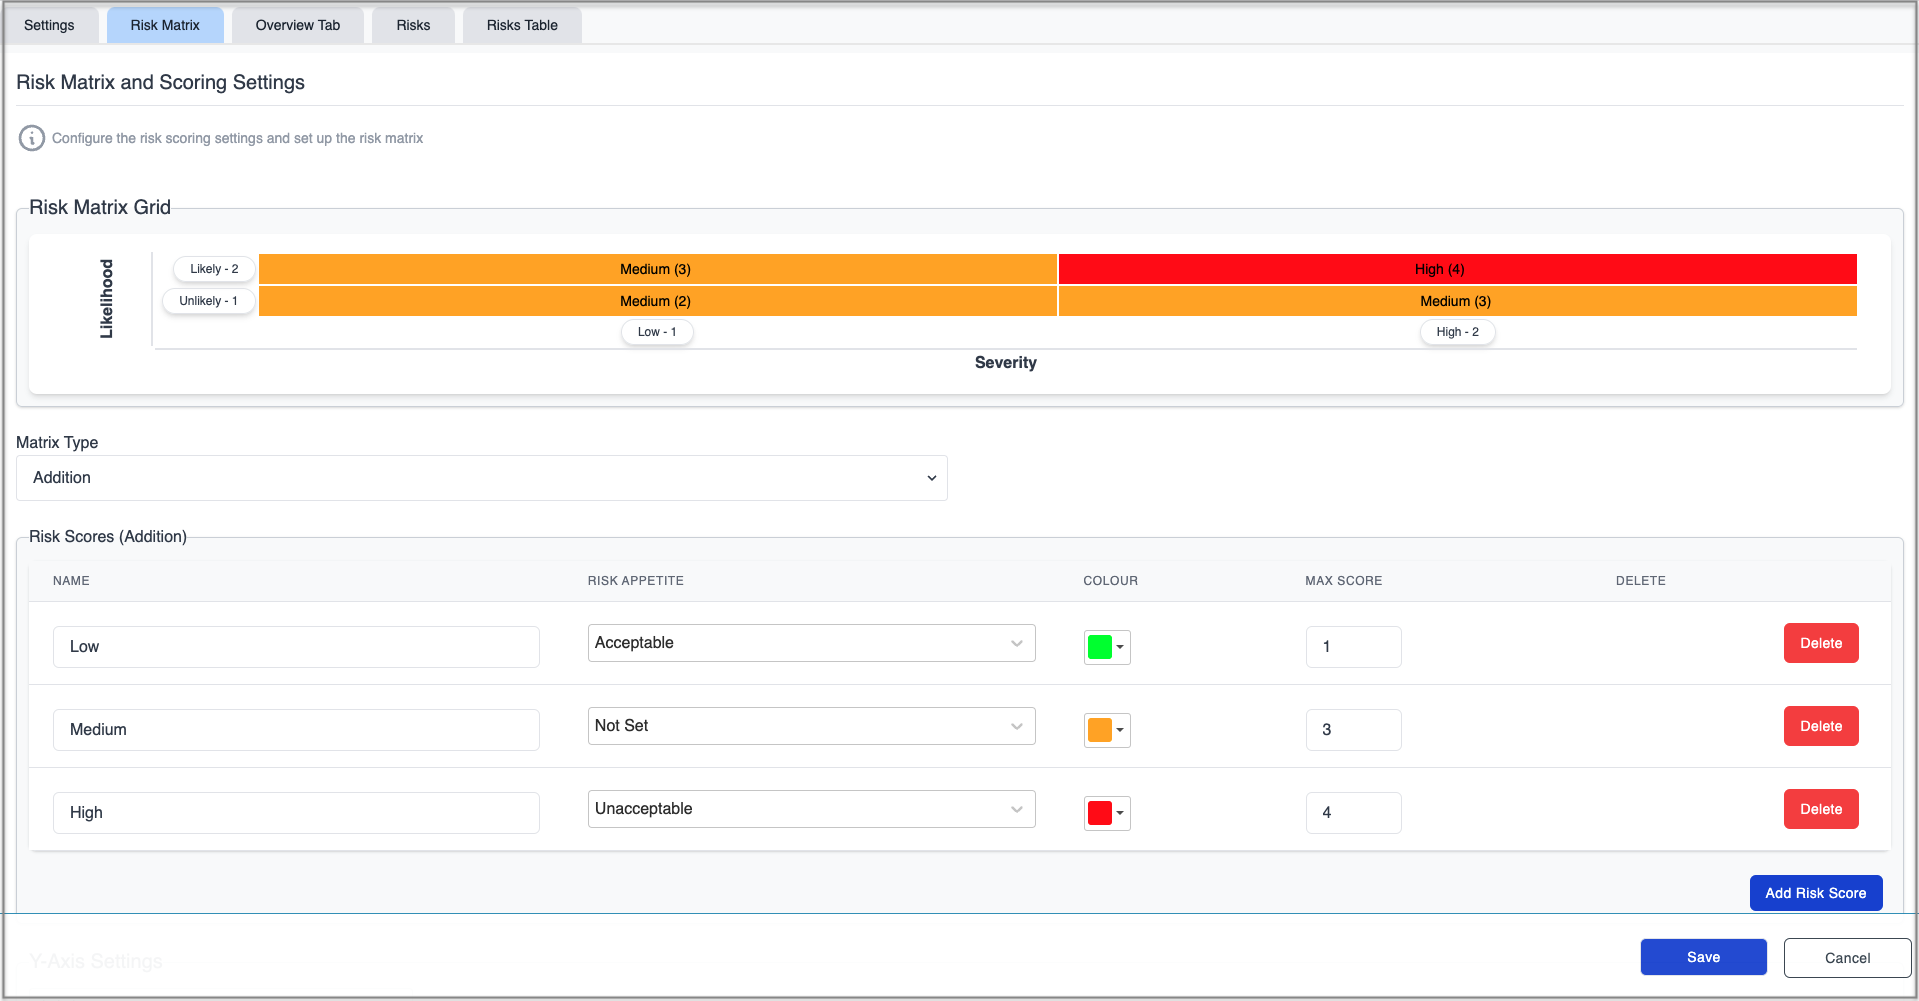
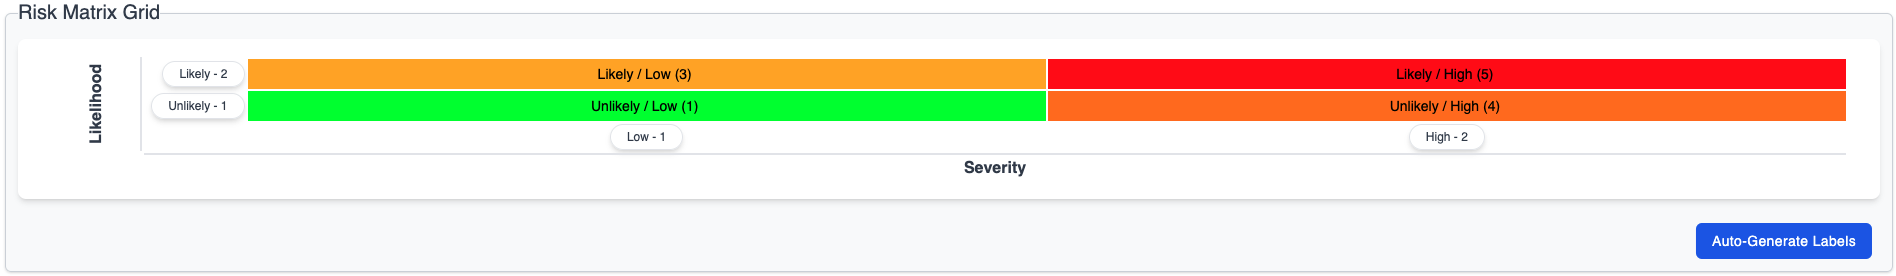
When clicking the Risk Matrix tab, a default 2x2 matrix is presented. It can be expanded to have more rows and columns as required. There are three options for the type of calculations used to produce risk scores: Addition, Multiplication or Manual.
The labels, values and colours are fully configurable and a ‘Risk Appetite’ (also known as, ‘Risk Threshold’ , ‘Risk Tolerance’ or ‘Risk Acceptance Criteria’ ) can be defined for different score ranges.
Scrolling down the page will reveal the areas where to configure Y-Axis Settings and X-Axis Settings for the matrix. The values entered in these sections will affect the values required for the Risk Scores section, so it makes sense to populate them first.
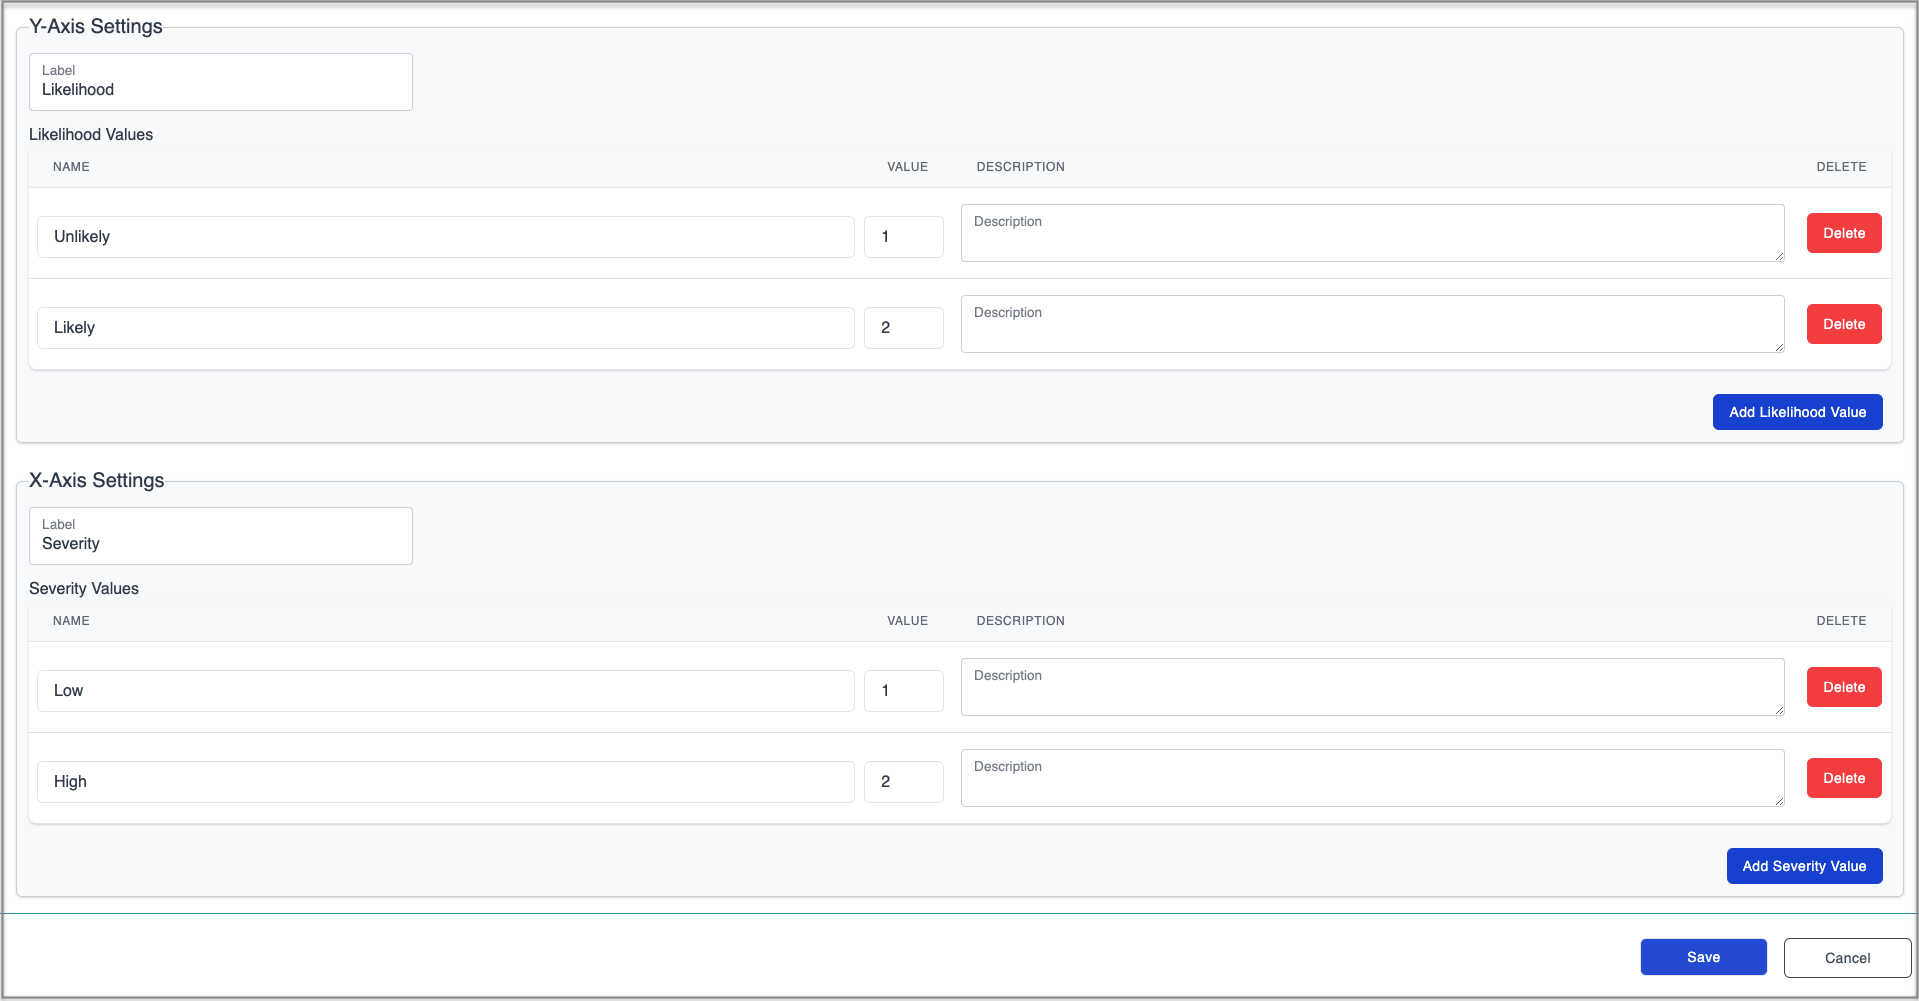
X-axis and Y-axis Settings
The Y-axis is normally associated with the probability of an occurrence and it’s commonly referred to as, Likelihood.
To configure the Y-axis:
- If appropriate, the default value of ‘Likelihood’ can be changed by clicking the Label field and replacing it with free text.
- Click the Add Likelihood Value button to add as many rows as the matrix needs (this button’s label will change with the name assigned in the Y-axis ‘Label’).
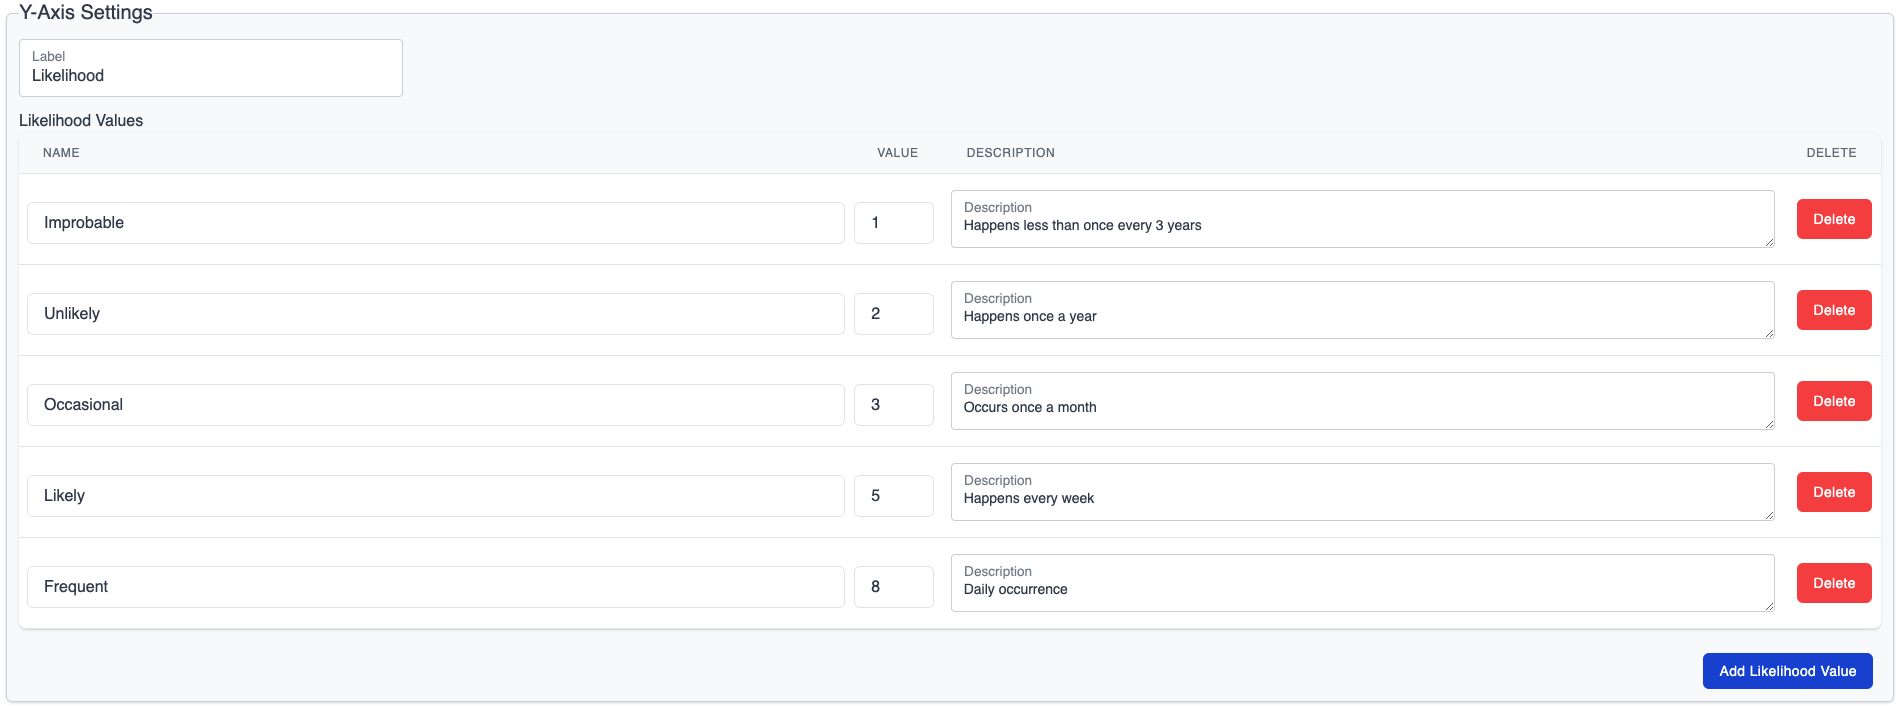
A Delete button on the right allows removing unwanted rows. - Enter a NAME for each likelihood value in the free text fields provided. The names should be in order, by level of probability. For example, values can be entered in this order, ‘Improbable’, ‘Unlikely’, ‘Occasional’, ‘Likely’ and ‘Frequent’.
- Enter a numerical VALUE, equivalent to each likelihood. For example, ‘Improbable’ = ‘1’, ‘Unlikely’ = ‘2’, etc.
- Enter a Description for each likelihood item. For example, the level, ‘Occasional’ can carry the description, “Occurs once a month”. Populating these fields is not required but they help explain what each level means in the context of the risk assessment they will be used for.
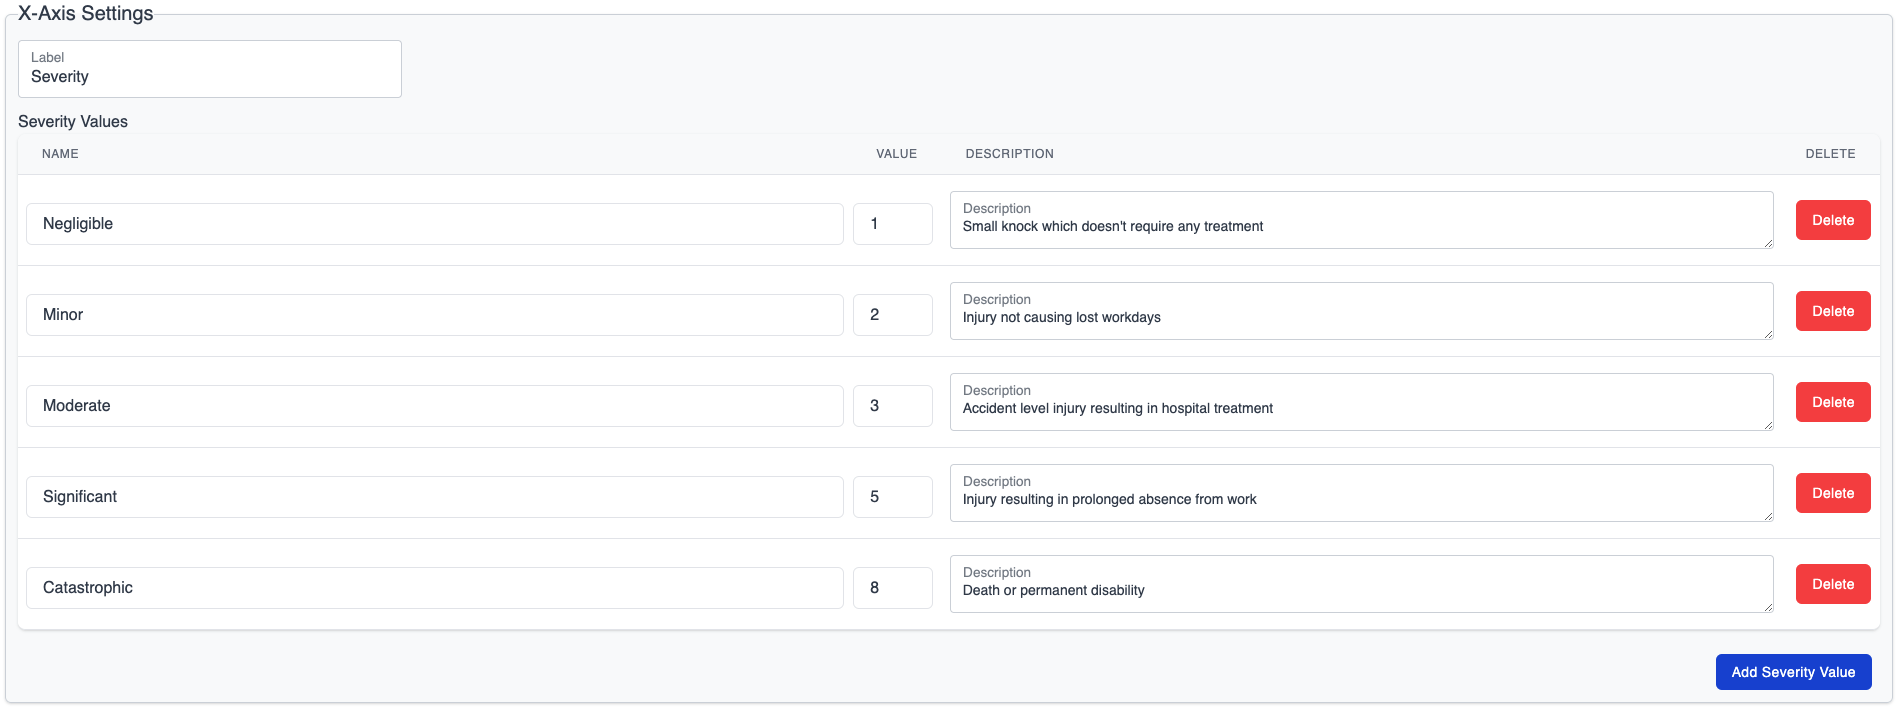
The X-axis is normally associated with the severity of the risk being measured. It can be configured following the same steps as for the Y-axis.
An example of severity names in a 5x5 risk matrix can be, ‘Negligible’, ‘Minor’, ‘Moderate’, ‘Significant’ and ‘Catastrophic’.
The descriptions can apply to different industries and contexts. For example, if the severity refers to the harm someone might suffer, the descriptions for the items above could range from, “Small knock which doesn’t require any treatment” to, ‘Death or permanent disability’.
There is a Save button always present in the bottom right corner of the screen to save progress at any time.
Matrix Type
The Matrix Type field allows selecting the type of operation used to calculate the risk scores on the matrix.
The three types available are:
- Addition - the likelihood and severity values are added to produce a score
- Multiplication - the likelihood and severity values are multiplied to produce a score
- Manual - values, labels and colours are not calculated by the system but assigned by the user in each matrix cell
When the manual type of matrix is selected, clicking any cell in the matrix, will bring up the lightbox below.
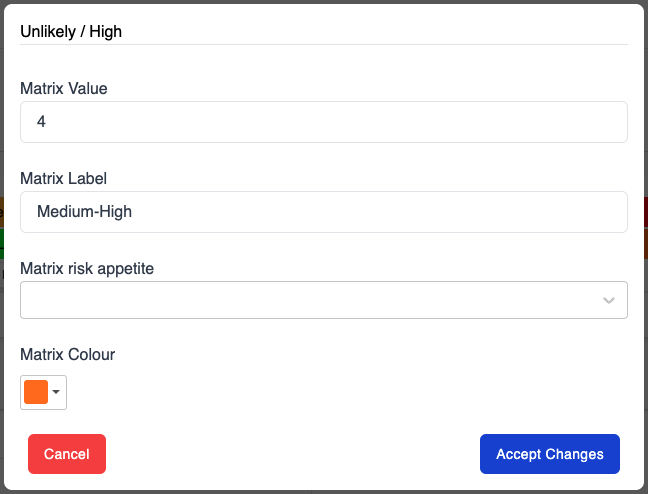
- The ‘Matrix Value’ field only accepts whole numbers.
- If desired, the button, ‘Auto-Generate Labels’ (found in the bottom right of the Risk Matrix Grid area) can be used to let the system label each cell. It will automatically generate labels by combining the likelihood and severity levels corresponding to that cell. This won’t affect the colours or values already assigned.
Risk Scores
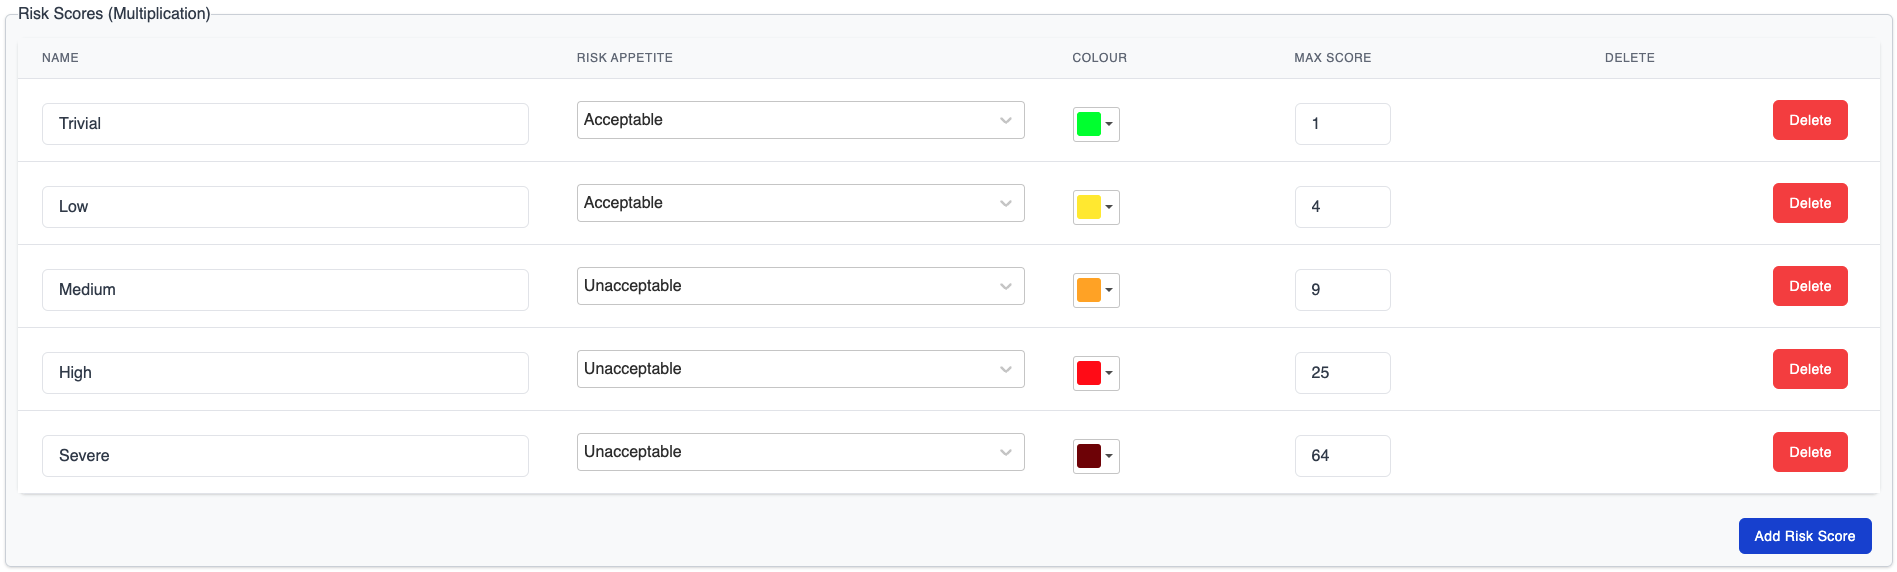
The Risk Scores define the ranges of values for each risk level. For example, if the risk level, ‘Low’ is given a score of 4 and the level, ‘Medium’ is given a score of 9, then any scores from 5 to 9 will be labelled as a ‘Medium’ risk.
New risk matrices default to 3 ranges (‘Low’, ‘Medium’, and ‘High’) but more can be added.
To configure the risk levels and scores of a risk matrix:
- Use the Add Risk Score button to add more risk levels if required.
A Delete button on the right allows removing unwanted levels. - Adjust the NAME of each risk level from low to high
- Select the RISK APPETITE for each range from the dropdown menu (Acceptable, Unacceptable)
- Select a COLOUR for each range by clicking the field and choosing one from the pallet
- The MAX SCORE value needs to be considered to achieve the desired risk ranges.
- The highest score should be equal to,
- The sum of the highest y-axis value and the highest x-axis value if using the matrix type, ‘Addition’, or
- The multiplication of the highest y-axis value and the highest x-axis value if using the matrix type, ‘Multiplication’, or
- A suitable integer which will allow producing the intended score ranges.
- The same number can’t be used in two risk levels.
Any changes made in the ‘Risk Scores’ area will be immediately reflected in the Risk Matrix Grid.
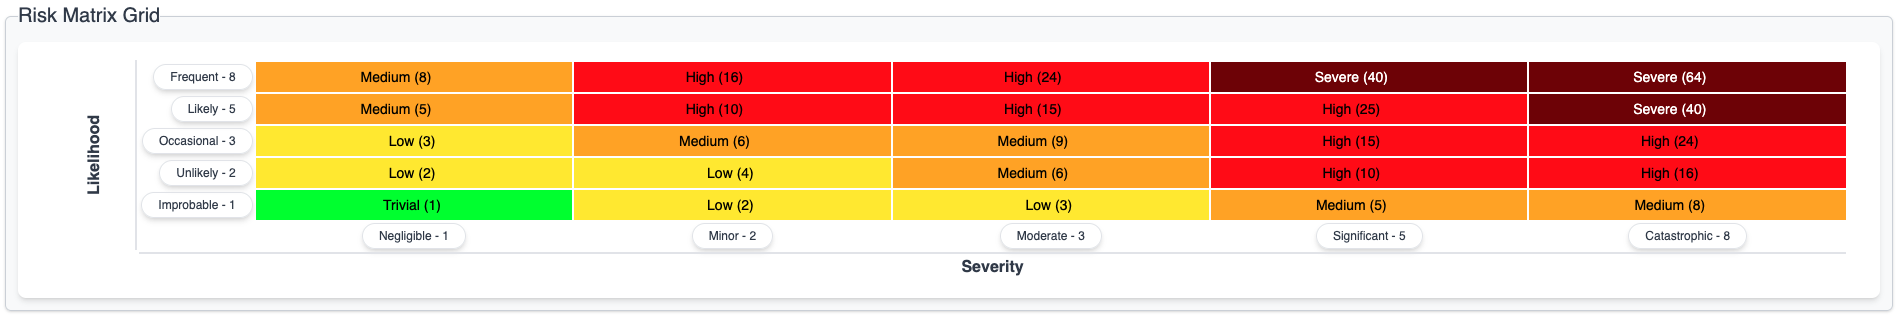
It is possible to switch the Matrix Type to ‘Manual’ after it has been configured as an ‘Addition’ or ‘Multiplication’ type.
This allows adjusting labels and colours of cells to differentiate instances which result in the same score. For example, in the image above, a risk which is ‘occasional’ and ’negligible’ has the same score of 3 as a risk which is ‘improbable’ and ‘moderate’. The colour and label of one of the cells can be edited to indicate it is a different kind of low risk.
NEXT STEP: Overview Tab Configuration
PREVIOUS STEP: Risk Assessment Configurations