- Metrics
Metrics - KPIs
Introduction
The Metrics area of iPassport provides a set of predefined metrics and widgets plus the ability to intuitively create new metrics. Quality managers are able to drill into the data collected in iPassport, study trends and see if objectives and targets are being reached.
Metrics and widgets can be organised in user configurable Dashboards. Metrics charts can also be printed or downloaded in several formats, directly from a dashboard. External links can be created to generate up to date charts outside of iPassport in a web browser, without need to log into iPassport.
There is also a tab that contains Predefined Metrics, which belong to an earlier collection of metrics and will remain there until the metrics module is developed to allow creating them and using them in dashboards.
Permissions
To view the Metrics area, the permission, Metrics: View Metrics is required. It’s included in the system role, Administration Editor and all the Global Editor and Global Viewer roles.
Additionally, the permission, Metrics: Manage Metrics is needed to create and edit metrics and dashboards. This one is included in the Administration Editor and both Global Editor roles.
Viewing and Managing Dashboards
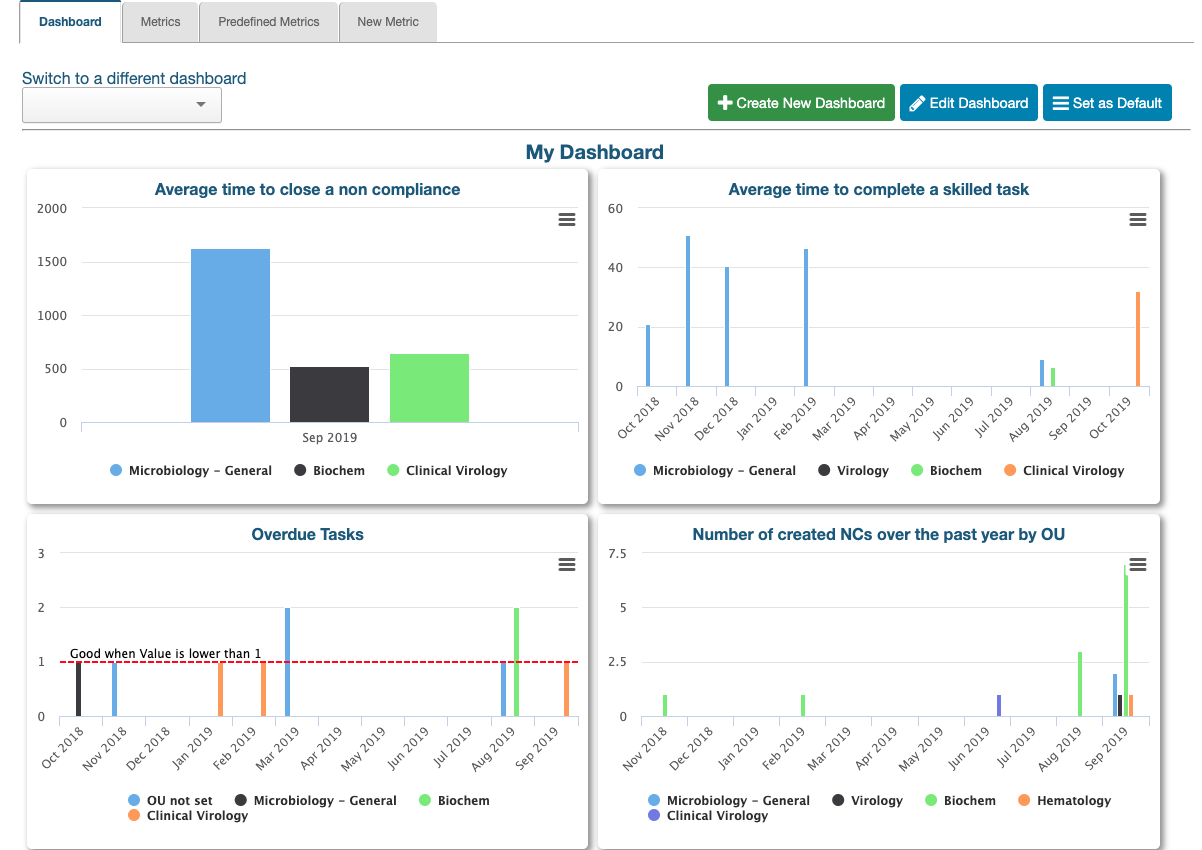
When Metrics is clicked in the global menu, the Dashboard tab opens by default. The dashboard that has been set as default will show and the dropdown menu, Switch to a different dashboard allows selecting a different one at any time. All dashboards allow adding up to 10 metrics or widgets and they are all conveniently visible on one page. When a dashboard is not the default one to show upon opening the tab, it will offer the button, Set as Default on the top right. If you click the button, it will disappear and the open dashboard will become the new default.
To create a new dashboard:
- In the Metrics > Dashboard tab, click +Create New Dashboard
- Enter a Name in the field provided in the lightbox that pops up
- Tick the checkbox under, Share this Dashboard with all users, if other users should be allowed to edit it (they won’t be able to delete it); if not shared, other users won’t even see the metric
- Click Save to create the new dashboard
Then, to edit it: - Click any box that has the message, + Add a new widget
- In the lightbox that pops up, select either Metrics or Widgets
- Select an item from the dropdown menu under Select metric/widget to add to the dashboard
- Click the Add Metric/Add Widget button
- Add more metrics or widgets as required
- Click Save Dashboard when done
While the dashboard is in editable state, metrics and widgets can be dragged and dropped to another location. They can also be removed from the dashboard by clicking the (X) in their top right corner. Once the Save Dashboard button is clicked, items will be automatically moved to fill any empty spaces near the top.
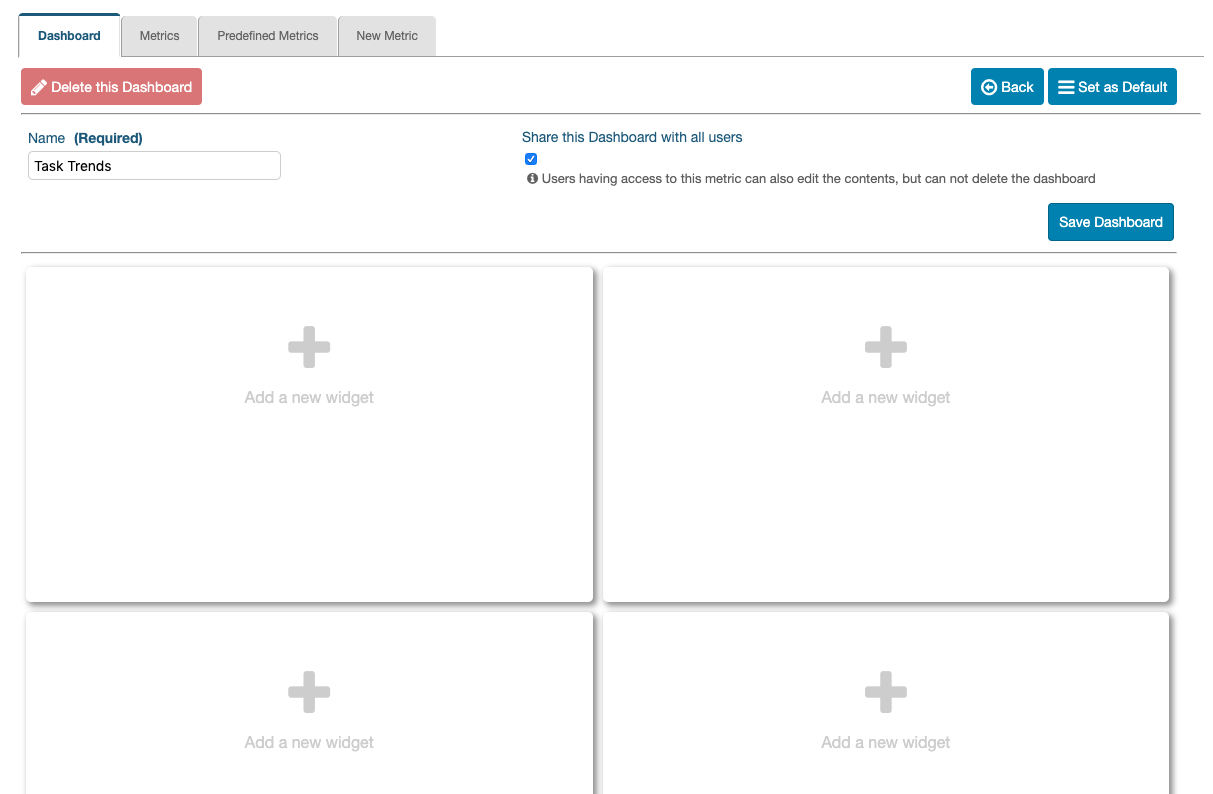
Dashboards can be edited to add, remove or reorganise items by clicking the Edit Dashboard button that appears above them. The Save Dashboard and Delete this Dashboard buttons become available while dashboards are in an editable state. To cancel any changes made while editing, click the (<-)Back button and the dashboard will return to its previous state.
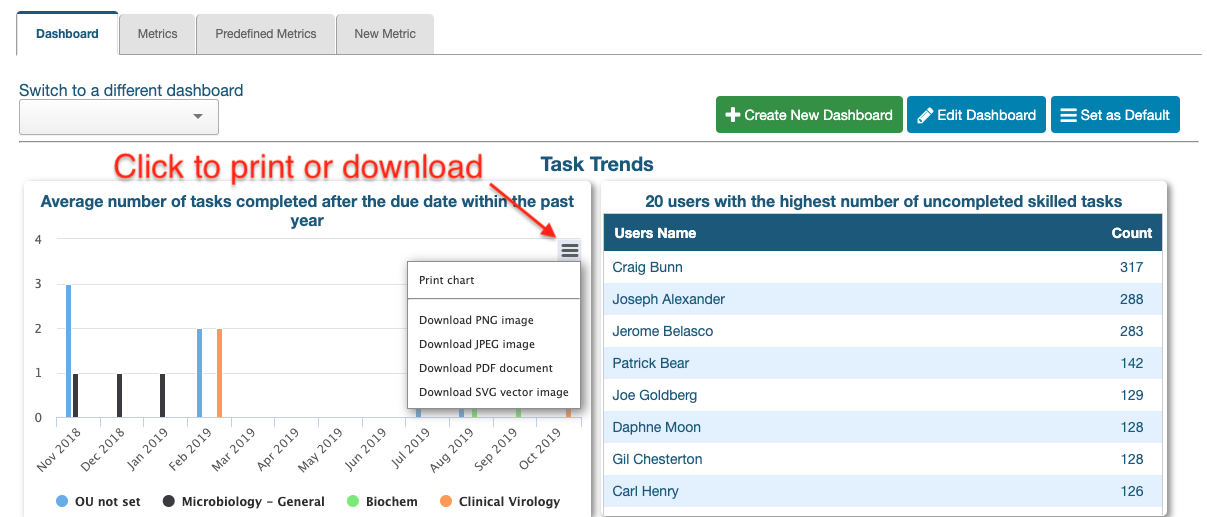
Metrics charts can be printed or downloaded by clicking the icon depicted in the image below. Charts can be downloaded in the following formats: PNG, JPEG, PDF or SVG vector image.
Managing Metrics
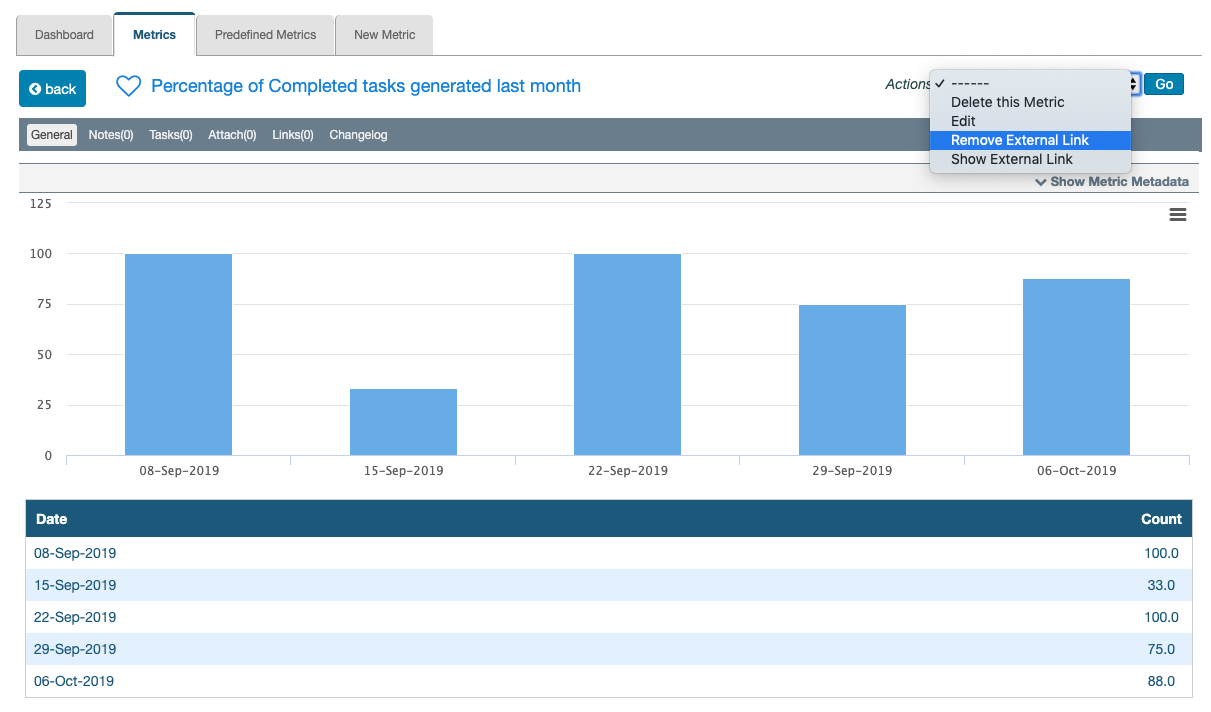
The Metrics tab (Metrics > Metrics) lists all the metrics available, both those supplied by default and those created by users in the account. Clicking any row in the list opens the particular metric to display its chart and a summary of data collected for it below. Hovering over the chart items brings up information tags with details for each item (point, column, bar).
The filters used to create the metric can be viewed by clicking the bar marked, Show Metric Metadata. The area expands to reveal the information and it can be collapsed again by clicking the same bar, which will have toggled to say, Hide Metric Metadata.
The usual tabs are available to add Notes, Tasks, Attachments and Links and there is a Changelog to keep track of the history of the metric.
External Links to Metrics
Metrics can be accessed externally via a web browser without having to log into iPassport. When they are invoked, they generate a fresh chart from up to date information in the account.
To access a metric externally:
- Open the metric from the Metrics tab by clicking its row
- Click the Actions field and select, Create External Link
- Click Go
- In the lightbox that pops up, click Copy Link (to Clipboard)
- Store the link if necessary and paste it in a browser to generate the chart at any time
The link can be broken if required by selecting, Remove External Link from the Actions dropdown menu and clicking Go.
Creating New Metrics
iPassport offers an intuitive interface to create metrics and add KPIs with a growing pool of data sources and filters to build charts. The charts can cover periods of time from one month to the entire life of the account and the granularity can be set from one day to one year.
The first step is to select a data source and subsequently narrow it down by using the criteria available, which includes ‘creation date’, ‘completion date’, ‘due on’ and more. The chart can display calculations of counts of items, time taken to complete events and percentages. For percentage calculations, a subset of the data can be produced by using the same process as for the main data set. Single OUs (Organisational Units) can be selected to generate charts but if more than one OU is selected, the data can be displayed by OU or for the entire collection. A KPI threshold can be added to make it easier to view what periods are out of target.
To create a metric:
-
Go to Metrics > New Metric
-
Select a Data Source Type from the dropdown menu available; the page will then populate with relevant fields
-
Enter a Name for the metric in the field provided
-
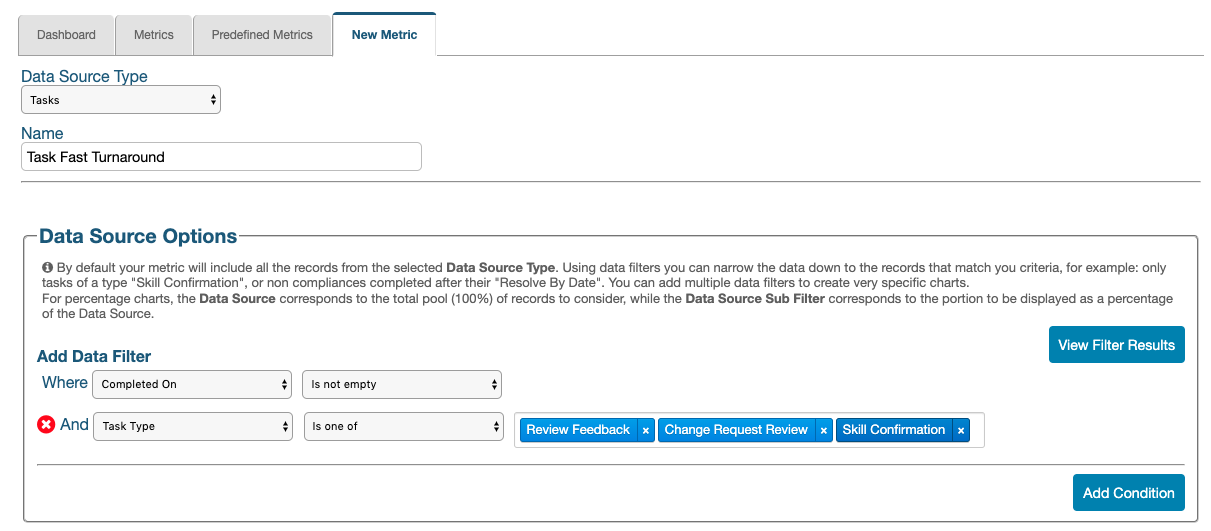
In the Data Source Options area, under Add Data Filter, click in the field, Where
-
Select a parameter from the dropdown list
-
Depending on the selection made, different additional filters will appear to build the criteria for the data set; choose parameters from the dropdown menus supplied
-
Preview the results of the data filter by clicking, View Filter Results at any time
If invalid filters are selected, the following message will show when clicking, View Filter Results: “Filter results cannot be loaded. Make sure the filter options are setup correctly.”
-
More conditions can be added by clicking Add Condition (they can also be removed by clicking the (X) on their left)
-
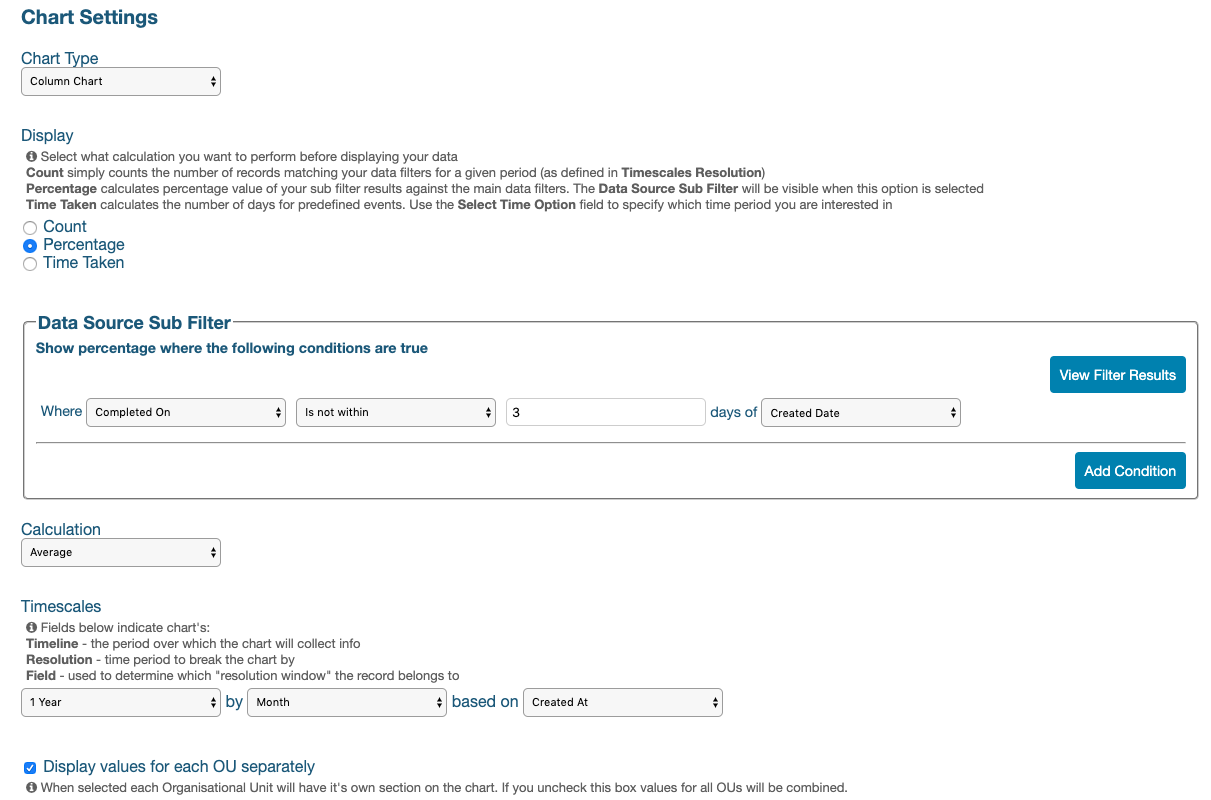
In the Chart Settings section, select a Chart Type from the dropdown menu
-
Under Display, select the type of calculation to perform with the data: Count, Percentage or Time Taken
If Percentage is selected, a Data Source Sub Filter area becomes available. This sub filter should be a portion of the data set created above so it can be displayed as a percentage of the total (the Data Source Options set = 100%).
If Time Taken is selected, the Select Time Option field becomes available. The choices are, Time to Complete or Number of Days Past Due Date. -
Under Calculation, select whether the chart should be built using Average, Maximum or Minimum values where applicable (e.g., when calculating time taken)
-
Under Timescales:
- Select the timespan of the chart from the dropdown menu in the first field (it can range from one month to the total time since the account was created, ‘Beginning of time’)
- from the dropdown menu in the second field, select the granularity of the chart time periods (it can break the timespan into days, weeks, months or years)
- In the third field, choose in which time period the data should be placed, based on one of the options from the dropdown menu (e.g., you can put records in the period where they were created or in the period where they were completed)
- Tick the checkbox by Display values for each OU separately to produce a chart with separate data for each OU in every time period
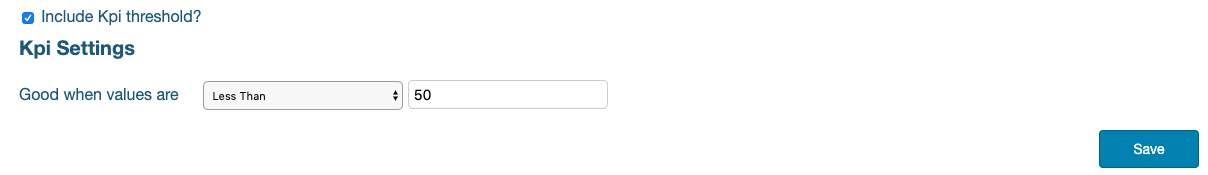
- To include a KPI marker in the chart:
- tick the checkbox by, Include Kpi threshold?
- In the field by, Good when values are, select More than or Less than from the dropdown menu
- Enter a relevant KPI number in the field on the right
- Click Save to finish the metric creation and display it on the screen
A metric can be edited or deleted from the Actions menu. When editing a metric, the conditions used in the source filter and sub filter can’t be modified. They have to be deleted by clicking the (X) on their left and then recreated starting from the Where field just below.
Designing Metrics - a worked example
The functionality of the Metrics module will be expanded over time to include more parameters and data sources. If there is a particular Widget or Metric that can’t be presently developed from the user interface, please contact the support team ([email protected]). If feasible, they will endeavour to produce it and add it to the system.
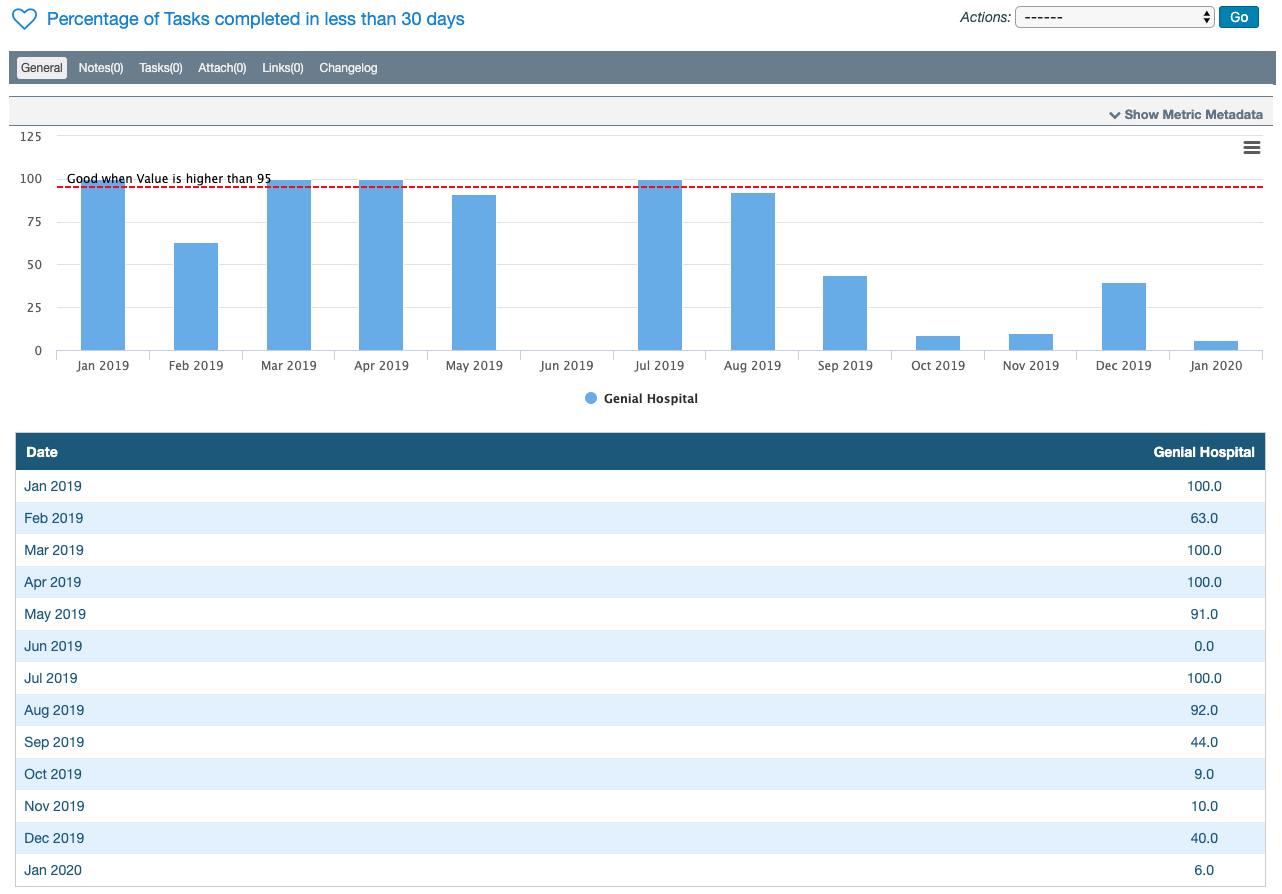
To illustrate the mechanics of this feature a Metric can be created, following the example below. It displays the percentage of tasks of a particular OU that were completed in less than 30 days.
These would be the steps to follow:
-
Go to Metrics > New Metric
-
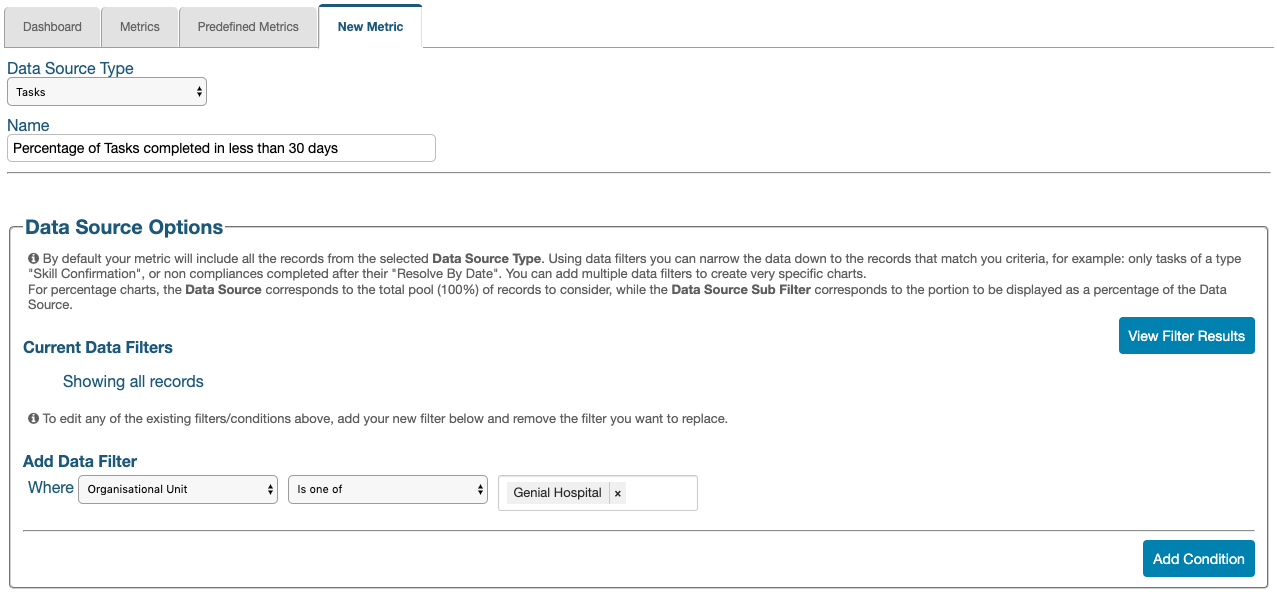
Select the Data Source Type, Tasks
-
Enter the Name, “Percentage of Tasks completed in less than 30 days” in the field provided
-
In the Data Source Options area, under Add Data Filter, click in the field, Where
-
Select, Organisational Unit from the dropdown list
-
Click the field that appears and select, Is one of
-
Click the next field that appears and select an OU from the dropdown list
-
Preview the results of the data filter by clicking, View Filter Results
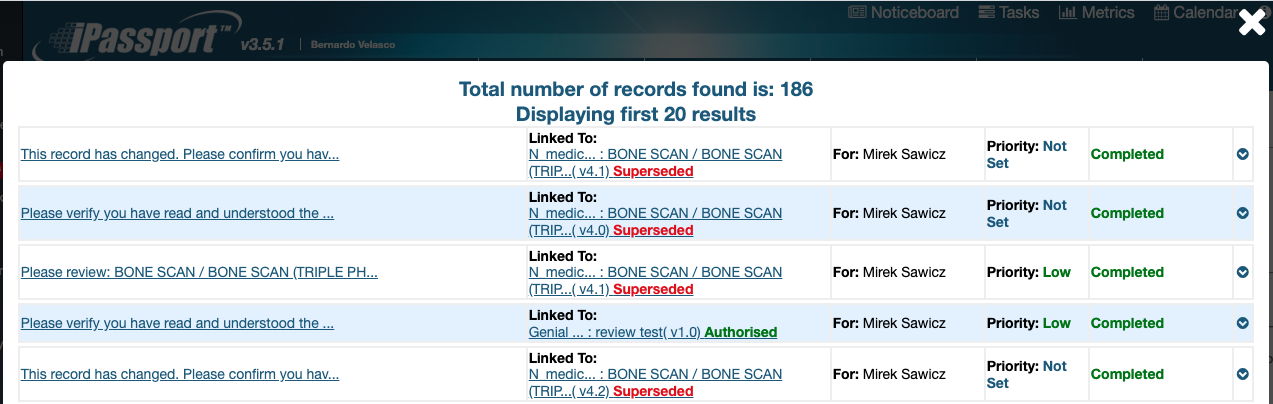
The Data Source filters produce the total pool of records to calculate a percentage (equivalent to 100% of the records to consider).
If no results are obtained through the above filter, the following message will show when clicking, View Filter Results:
“Total number of records found is: 0
No results found for selected filter” -
Click the “X” at the top right of the screen to return to the Metric design page
-
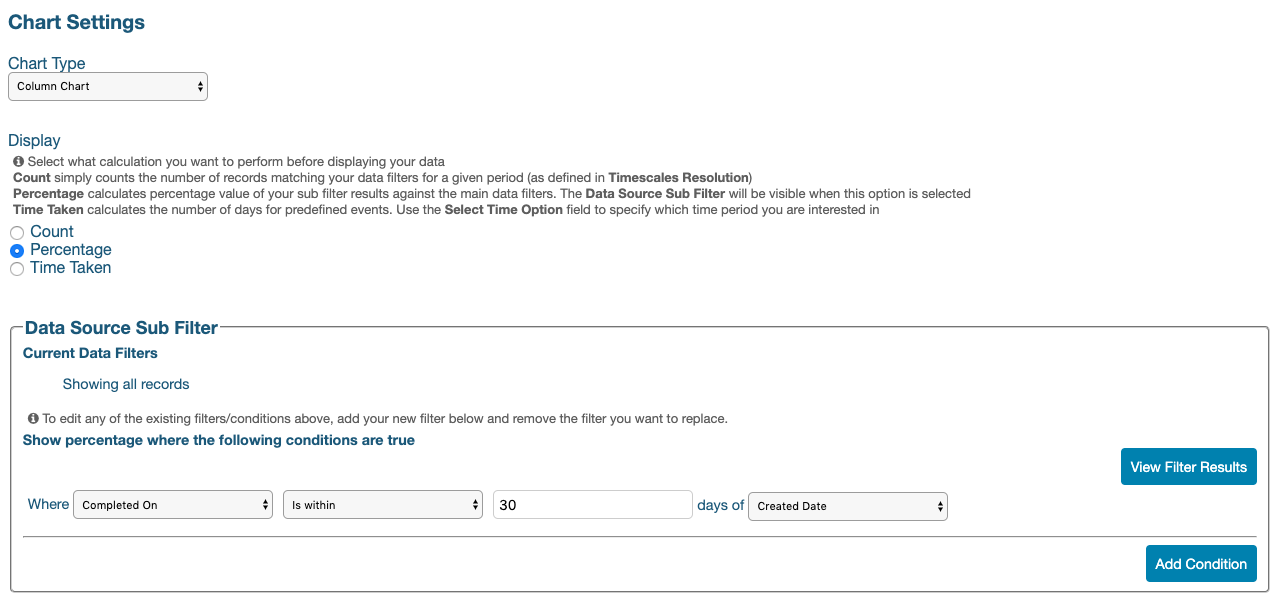
In the Chart Settings section, select the Chart Type, Column Chart from the dropdown menu
-
Under Display, select Percentage
-
In the Data Source Sub Filter area that appears, click the Where field and select, Completed On
-
Click the field that appears and select, Is within
-
Click the next field that appears and enter the number “30”
-
Click the field that appears after “days of” and select, Created Date
-
Preview the results of the data sub filter by clicking, View Filter Results
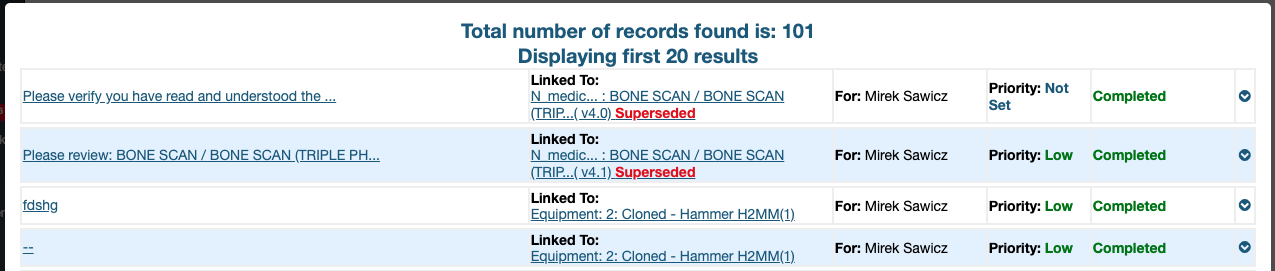
The number of records found should be a portion of the number of records obtained in the main filter above.
-
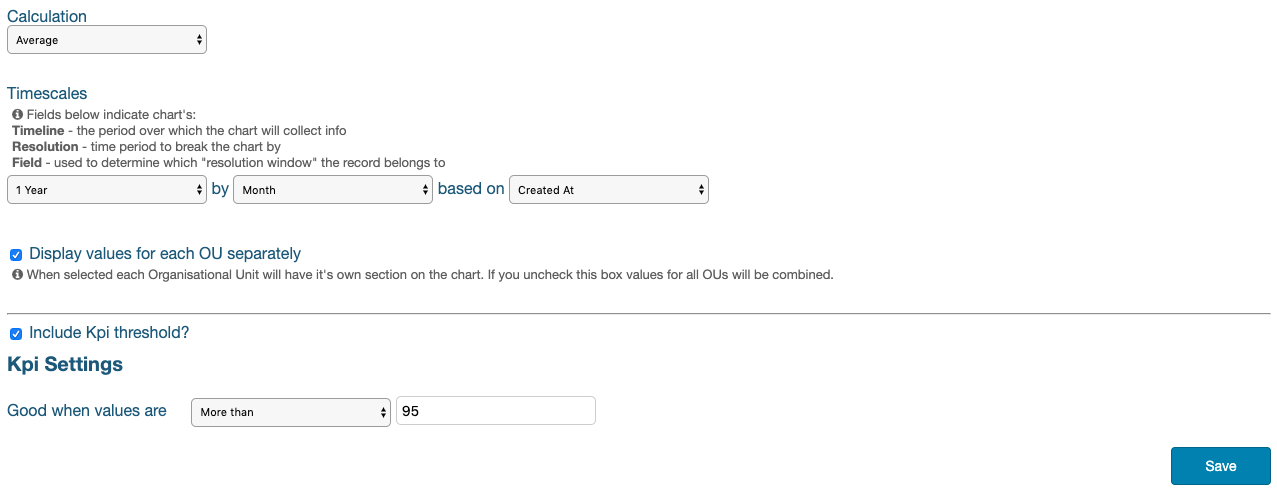
The Calculation parameter has no incidence in this example - it can be ignored
-
Under Timescales, leave the default values of, “1 Year”, “Month” and “Created At”
This means that the chart will be built using only tasks created in the last year, it will be broken into units of one month and the tasks will be placed in the month they were created.
-
The checkbox by Display values for each OU separately can be left ticked; it won’t matter because only one OU is being looked at in this metric
-
Tick the checkbox by, Include KPI threshold?
-
In the field by, Good when values are, select More than from the dropdown menu
-
Enter the number “95” (the target percentage of tasks to be completed within one month)
-
Click Save to finish the metric creation and display it on the screen
The Metric should appear on screen upon saving.
-